Air Pollution Causes Non-Lung Cancer Deaths
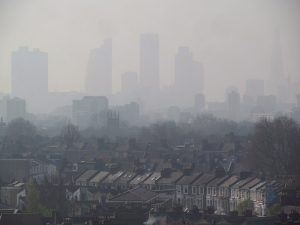
London Smog. Photo by David Holt
Medical researchers have known for awhile that air pollution can cause conditions related to the lungs. These include asthma, allergies and even lung cancer.
But few imagined that breathing air polluted air might cause other types of cancer. Yes, we are talking breast cancer, liver cancer, pancreatic cancer, intestinal cancers and others.
In this article
PM2.5 pollution causes cancer deaths
Researchers from the UK’s University of Birmingham and Taiwan’s University of Hong Kong have determined that sustained exposure to air pollution causes deaths from various cancers.
The researchers followed 66,820 people from Hong Kong who were 65 years old or older from 1998-2001 through to 2011. They monitored the people for deaths due to any cancer.
The researchers calculated the subjects’ local air pollution through the period. This was based upon the recorded air pollution levels of monitoring stations near their homes. They also utilized satellite data.
Because Hong Kong has different air pollution levels in different parts of the city, it is an ideal place to study the effects of air pollution. Some districts of the city are on the shore, others are up high. And still others are within the industrial parts of the city.
The scientists specifically calculated the annual exposure of air pollution of PM2.5 particulates in micrograms per cubic meter for each person. PM2.5 particulates have an average diameter of 2.5 micrometers or less. PM2.5 has been accepted by many scientists as the most dangerous form of air pollution.
The researchers also eliminated the effects of other possible cancer causes, such as smoking and related conditions. They also eliminated deaths for the first three years of the study.
The researchers found that for each increase of 10 micrograms per cubic meter of PM2.5 air pollution on an annual basis increased deaths from breast cancer by 80 percent.
Each 10 ug/m3 of annual PM2.5 exposure increased deaths from upper digestive tract cancers (e.g. stomach cancers) by 42 percent. And for every 10 ug/m3 in PM2.5 increased deaths from cancer of other digestive organs – such as the gall bladder, bile ducts and pancreas – by 35 percent.
Interestingly, deaths from lung cancer increased 36 percent from PM2.5 exposure. Less than breast cancer and stomach cancers.
Deaths from all cancers increased by 22 percent for every 10 ug/m3 of PM2.5 annual exposure.
Note that the results are in graduated exposure levels. This means, for example, that a person with, say, 50 ug/m3 of PM2.5 annual exposure will have a 110 percent increased risk of any cancer, and a 400 percent increased risk of breast cancer.
Senior researcher Dr. Dr Thuan Quoc Thach from the University of Hong Kong commented on the surprising results, with other cancer deaths outside of the lungs connected with air pollution:
“Long-term exposure to particulate matter has been associated with mortality mainly from cardiopulmonary causes and lung cancer, but there have been few studies showing an association with mortality from other cancers. We suspected that these particulates could have an equivalent effect on cancers elsewhere in the body.”

Annual concentrations of PM2.5 exposure around the world
The 50 ug/m3 number I used above might sound pretty aggressive. But it’s really not that unreasonable. Yes, it is high in comparison to some cities around the world. But it is lower than some cities too.
The World Health Organization has monitored annual exposure levels around the world for several years. The world’s average, according to their calculations, was 71 ug/m3 per year. This ranged from 26 to 208 ug/m3 around the world. By region, Africa averaged 78 per year, while Europe averaged 49 per year.
Now consider a sampling of the World Bank’s average PM2.5 annual exposure per country around the world for 2013 (in ug/m3)
Afghanistan – 22
Argentina – 9
Bahrain – 44
Bangladesh – 48
Brazil – 16
Chad – 31
Egypt – 36
Germany – 15
India – 47
Israel – 26
Ireland – 8
Mali – 36
Mauritania – 70
Mexico – 12
Saudi Arabia – 54
Seychelles – 7
UK – 11
US – 11
Yeman – 36
I cherry-picked from this list, but you can see all of it here. Note that this is the average for the entire country. That means an average between the most polluted cities and the least polluted rural areas.
What about PM2.5 levels in different cities?
Many cities have high PM2.5 levels. Just consider the some of the average annual concentrations of PM2 from the World Health Organization in the table inserted. You can scroll down among the countries and cities.
[embeddoc url=”https://realnatural.org/wp-content/uploads/2016/05/OAP_database_8_2011.xls” viewer=”microsoft”]
Here you’ll see that cities in China will spike well over 100 ug/m3. Cities in Chile will be in the 50 to 60 range. India cities will range from 40 to well over 100 ug/m3 – with Delhi at 198, and Ludhiana at an astounding 251 ug/m3. Italy will top 40 in some cities, while France and Germany, and the U.S. and the UK will be in the teens and 20s.
While the average PM2.5 concentration may seem on the low side for many Western cities, this can be deceiving because this is often an average of different parts of the city, or even from one measuring station.
A home that sits on a busy road will yield a much greater concentration of PM2.5 exposure compared to a suburb off the main streets, for example.
This also goes for ones personal exposure. One person might spend more time biking or walking on busy roads, while another might live and work on the seashore, for example.
While industrial plants produce plenty of PM2.5, trucks also produce a considerable amount. Especially diesel trucks.
PM2.5 levels linked to deaths in other research
Analyses by the City of New York estimate that PM2.5 levels in the City caused more than 2,000 deaths per year between 2009 and 2011. It is also related to 4,800 emergency room visits and 1,500 hospitalizations.
A study from Harvard measured the long-term effects of PM2.5 pollution on death. They found that for every increase in 2 ug/m3 PM2.5 levels, there was a 3 percent increase in deaths from all causes. That is for younger and older people.
In areas of lower income and lower home value, the researchers found death increases were higher.
In India and China, hundreds of thousands of deaths per year are attributed to PM2.5 levels.
In 2006, Harvard researchers studied deaths linked to PM2.5 levels among six U.S. cities. They discovered that every 10 ug/m3 increase in PM2.5 increases the risk of death from heart disease by 28 percent, and deaths from all causes by 16 percent.

REFERENCES:
Wong CM, et al. Cancer Mortality Risks from Long-term Exposure to Ambient Fine Particle. Cancer Epidemiol Biomarkers Prev May 2016 25; 839. doi: 10.1158/1055-9965.EPI-15-0626
University of Birmingham. Exposure to particulate air pollutants associated with numerous cancers. Public Release: 29-Apr-2016
The World Bank. PM2.5 air pollution, mean annual exposure (micrograms per cubic meter). Based on: Brauer, M. et al. 2016. “Ambient Air Pollution Exposure Estimation for the Global Burden of Disease 2013.” Environmental Science & Technology 50, no. 1: 79–88.
WP6 ECRHS II FINAL REPORT European Community Respiratory Health Survey II Final Report of Work Package 6: PM 2.5 assessment in 21 European Cities of ECRHS II. May 2004.
The Guardian. Exposure to small particle air pollution: mapped by city. Accessed May 4, 2016.
New York State. PM2.5 Monitoring. Fine Particulate Matter Monitoring. Accessed May 4, 2016.
NYC Health. New York City Trends in Air Pollution and its Health Consequence. May 2013.
World Health Organization: 2014 Air Pollution Ranking. May 16, 2015.
Wichmann HE. Diesel exhaust particles. Inhal Toxicol. 2007;19 Suppl 1:241-4.
Wang Y, Kloog I, Coull BA, Kosheleva A, Zanobetti A, Schwartz JD. Estimating Causal Effects of Long-Term PM(2.5) Exposure on Mortality in New Jersey. Environ Health Perspect. 2016 Apr 15.
Laden F, Schwartz J, Speizer FE, Dockery DW. Reduction in fine particulate air
pollution and mortality: Extended follow-up of the Harvard Six Cities study. Am J Respir Crit Care Med. 2006 Mar 15;173(6):667-72.